IIT Delhi
Research on Indian Education system
Research on Indian Education system
Research on Indian Education system
Overview
Overview
Scope: Conduct research studies and design a solution that integrates 21st-century skills in Indian school students, under the guidance of: Prof. Jyoti Kumar for 2 months at IIT Delhi
Goal: Identifying a problem in the current education scenario, specially skill levels, and develop solution prototypes and test them with target users
My Role & Responsibilities
My Role & Responsibilities
As an intern, in a team of 5, my role was to carry out the entire research from beginning to end, starting from user interviews, thoroughly analyzing interview data, mapping collected information, creating journey maps, digitizing processes, coordinating focus groups, contributing to ideation sessions, and engaging in problem formulation
As an intern, in a team of 5, my role was to carry out the entire research from beginning to end, starting from user interviews, thoroughly analyzing interview data, mapping collected information, creating journey maps, digitizing processes, coordinating focus groups, contributing to ideation sessions, and engaging in problem formulation
Approach
Approach
An exploratory research undertaken to understand the needs of students studying in grades 5th to 8th, in Tier 1, 2 and 3 cities in India and mindsets of parents, teachers, schools and other stakeholders.
An exploratory research undertaken to understand the needs of students studying in grades 5th to 8th, in Tier 1, 2 and 3 cities in India and mindsets of parents, teachers, schools and other stakeholders.
Phase 1: Primary Data Collection
Phase 1: Primary Data Collection
Brainstorming Interview Questions: Formulating questionnaires for students, parents and teachers to collect data and record their experiences in person. Conducted a 102 interviews in total with all stakeholders.
Brainstorming Interview Questions: Formulating questionnaires for students, parents and teachers to collect data and record their experiences in person. Conducted a 102 interviews in total with all stakeholders.


Stakeholders Survey: A survey containing 10 objective and 1 subjective question was distributed, and received 200 responses
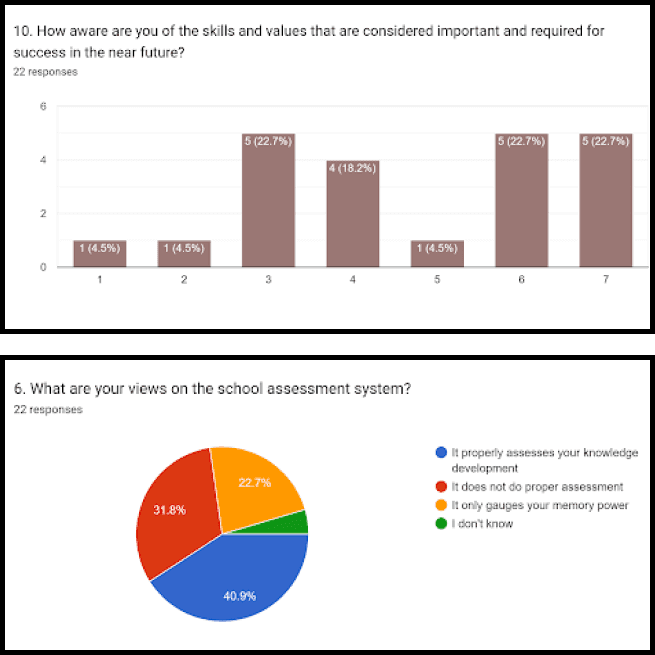
Children’s Survey Data
Children’s Survey Data
• Students are dissatisfied with the current assessment methods in school
• Students like those subjects better which they can relate with the real world
• Having a personal connection with teachers has a positive impact on learning
• Students like the practical learning approach
Since, we were conducting an open research and did not want to restrict ourselves to any one specific topic, we decided to go forward with the first set of interviews as unstructured- 57 interviews.
Later, after second round of themes development, we also conducted 5 semi-structured interviews
Where we made short notes of things we felt were important and color coded the insights for emotions. Then clustered these interview insights to find themes.
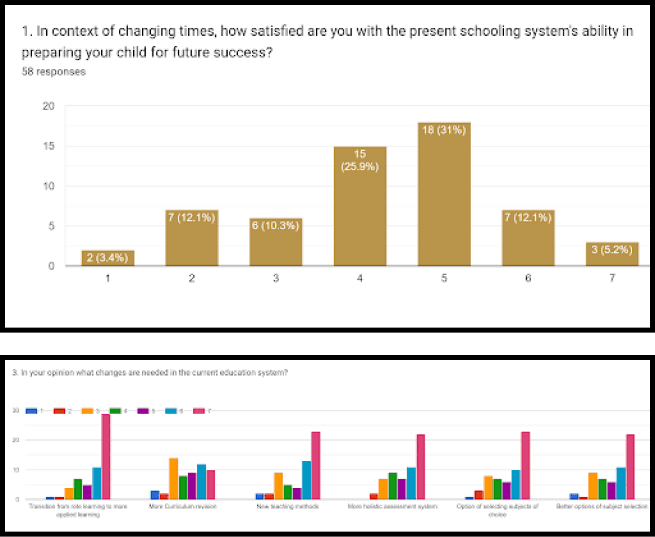
Parents’ Survey Data
Parents’ Survey Data
• Parents believe adaptability and communication were core skills in their success
• Concern about current education system placing more importance on marks than potential
• Parents believe that more screen time might hamper their child’s growth
• Honing extracurricular interests was also important for overall development
Since, we were conducting an open research and did not want to restrict ourselves to any one specific topic, we decided to go forward with the first set of interviews as unstructured- 57 interviews.
Later, after second round of themes development, we also conducted 5 semi-structured interviews
Where we made short notes of things we felt were important and color coded the insights for emotions. Then clustered these interview insights to find themes.
“ Children should be taught how to deal with failure and should be given more freedom of choices “
-Parent of a 9yr old
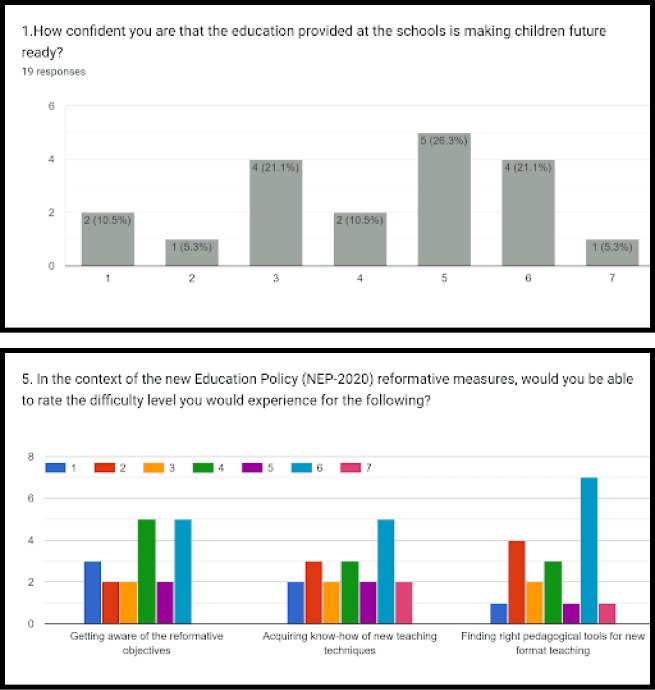
Educator’s Survey Data
Educator’s Survey Data
• Adapting teaching pedagogy according to the New Education policy, was a difficult change
• Applying creative teaching approaches in classrooms produced better learning outcomes
• The syllabus completion compulsion leaves little room to focus on each student individually at all times
• Reducing concentration levels of children, was a matter of concern
Since, we were conducting an open research and did not want to restrict ourselves to any one specific topic, we decided to go forward with the first set of interviews as unstructured- 57 interviews.
Later, after second round of themes development, we also conducted 5 semi-structured interviews
Where we made short notes of things we felt were important and color coded the insights for emotions. Then clustered these interview insights to find themes.
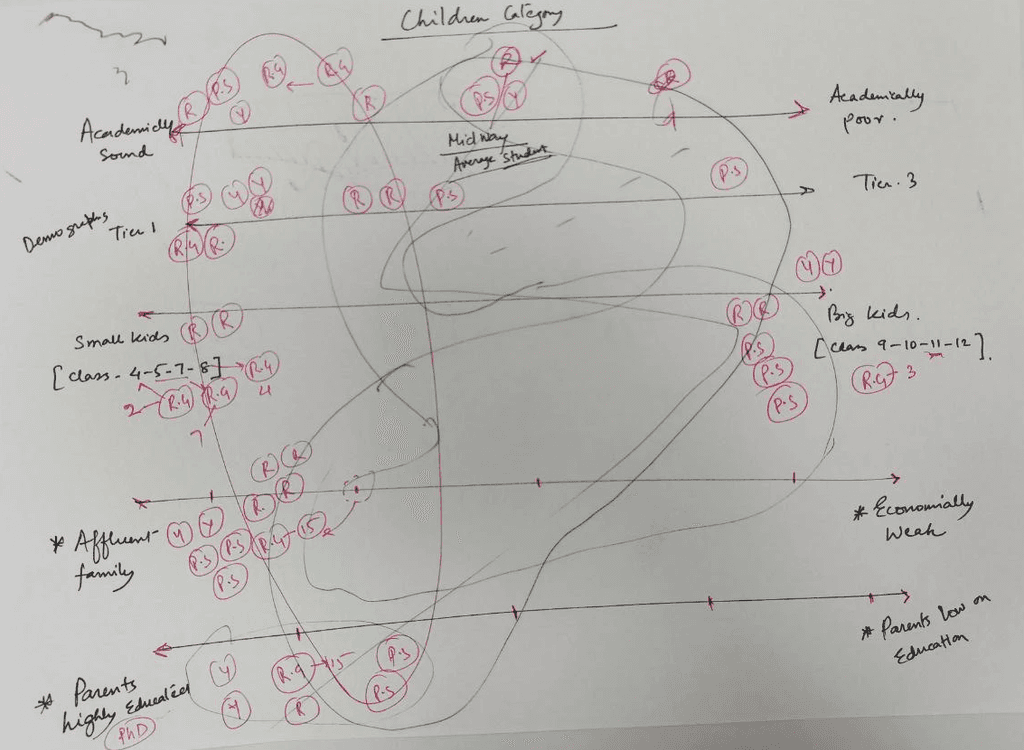
Phase 2: Analyzing Interview Data
Phase 2: Analyzing Interview Data
All Interview recordings were transcribed word-to-word and key points of interest extracted
All Interview recordings were transcribed word-to-word and key points of interest extracted

Journey Maps in Metro
Journey Maps in Metro
This is yet another interesting story, while traveling from my Home, to IIT Delhi, I plotted these maps to understand what students, parents and teachers' journeys
This is yet another interesting story, while traveling from my Home, to IIT Delhi, I plotted these maps to understand what students, parents and teachers' journeys
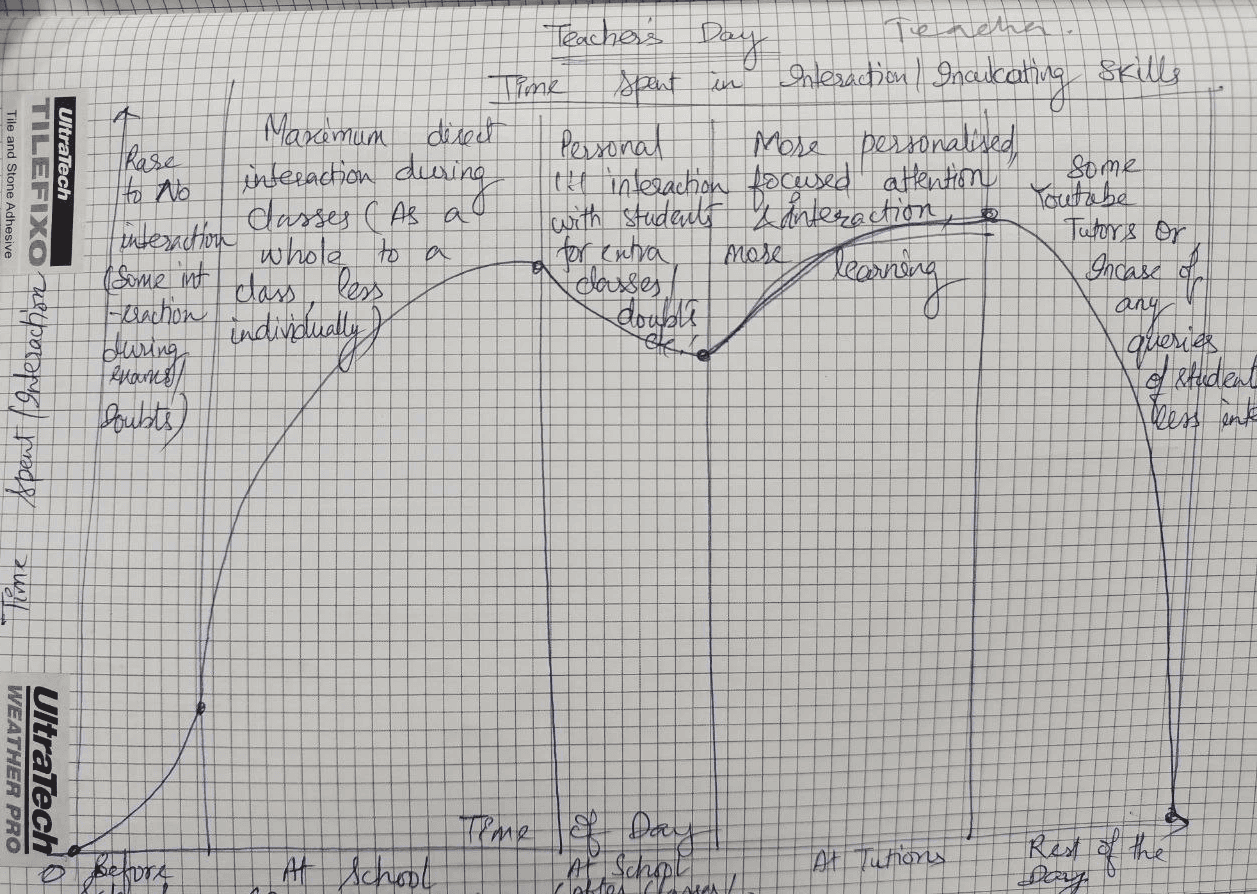
Teacher's Journey Map
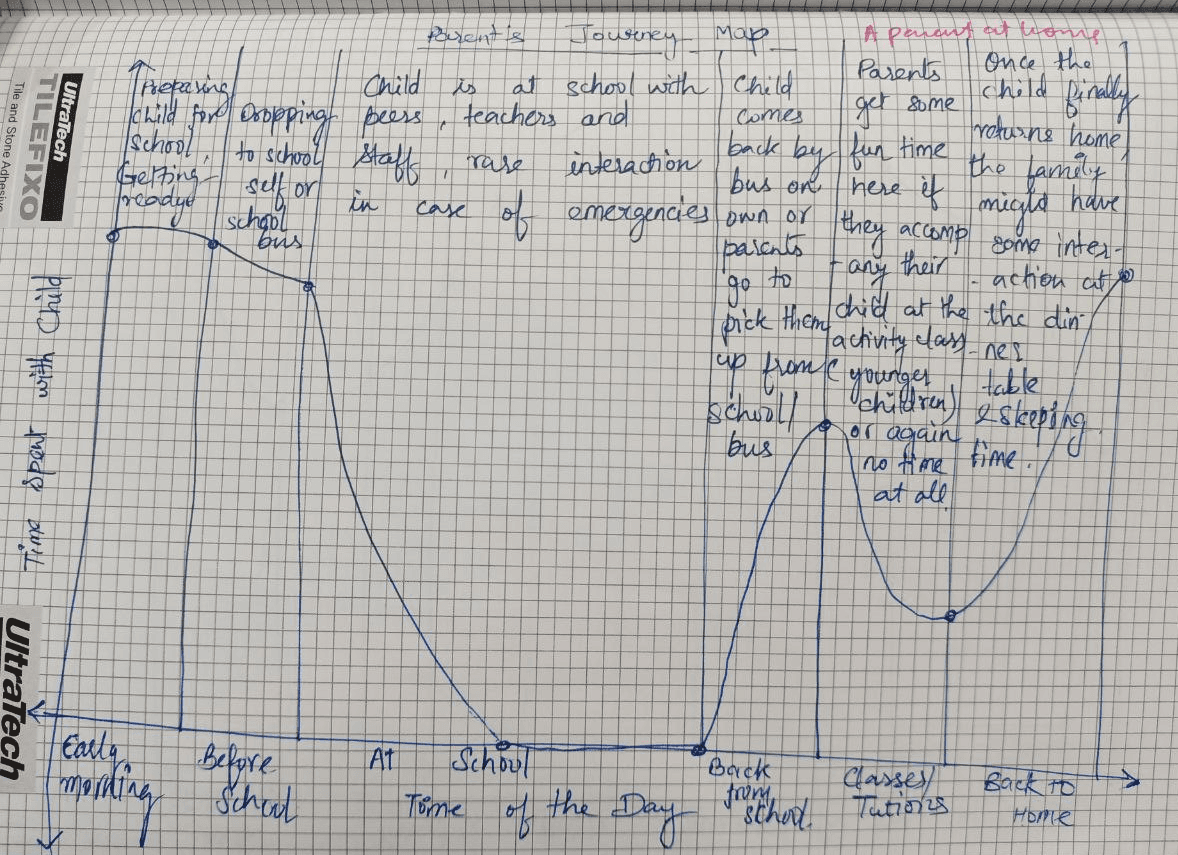
Parent's Journey Map
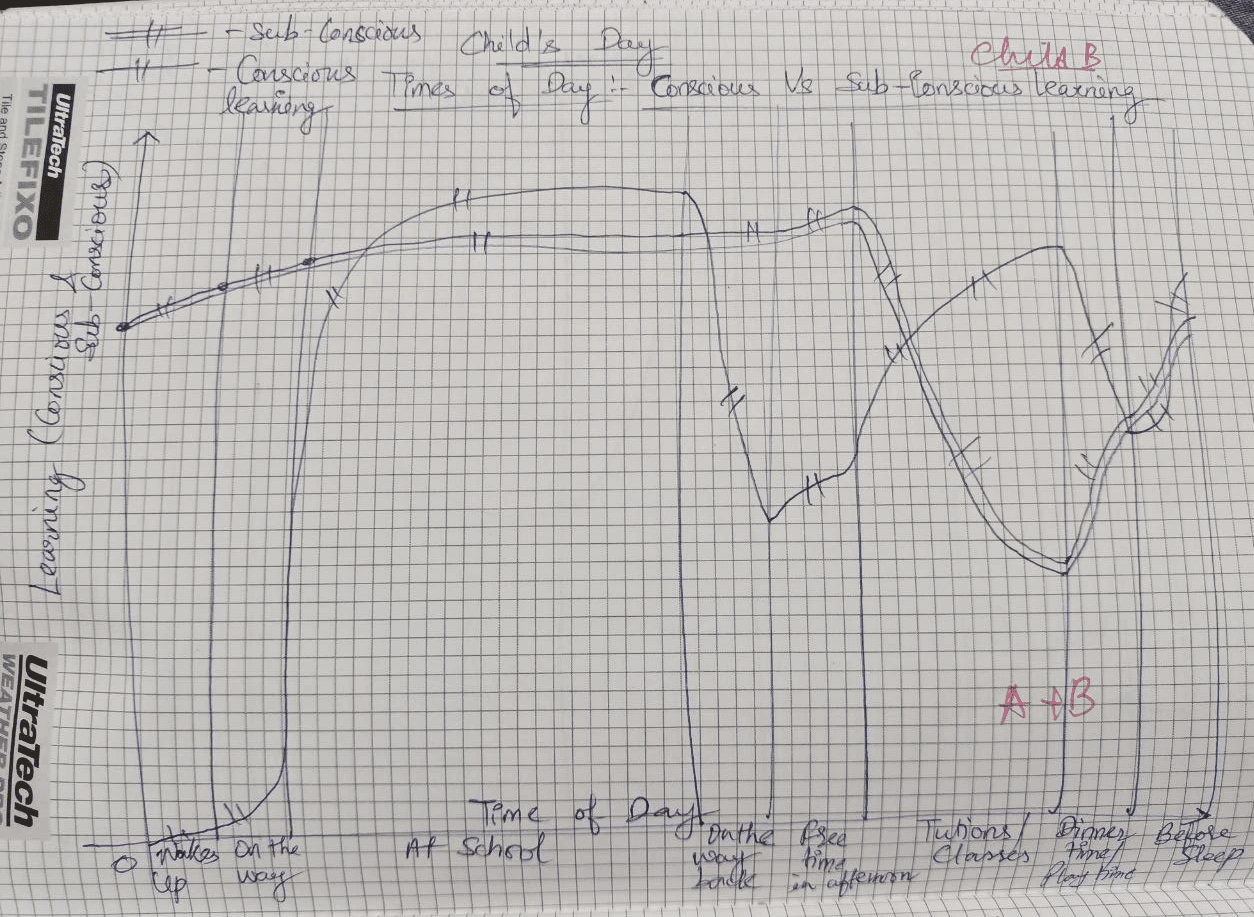
Child's Journey Map

Final Illustrated Journey Map by me
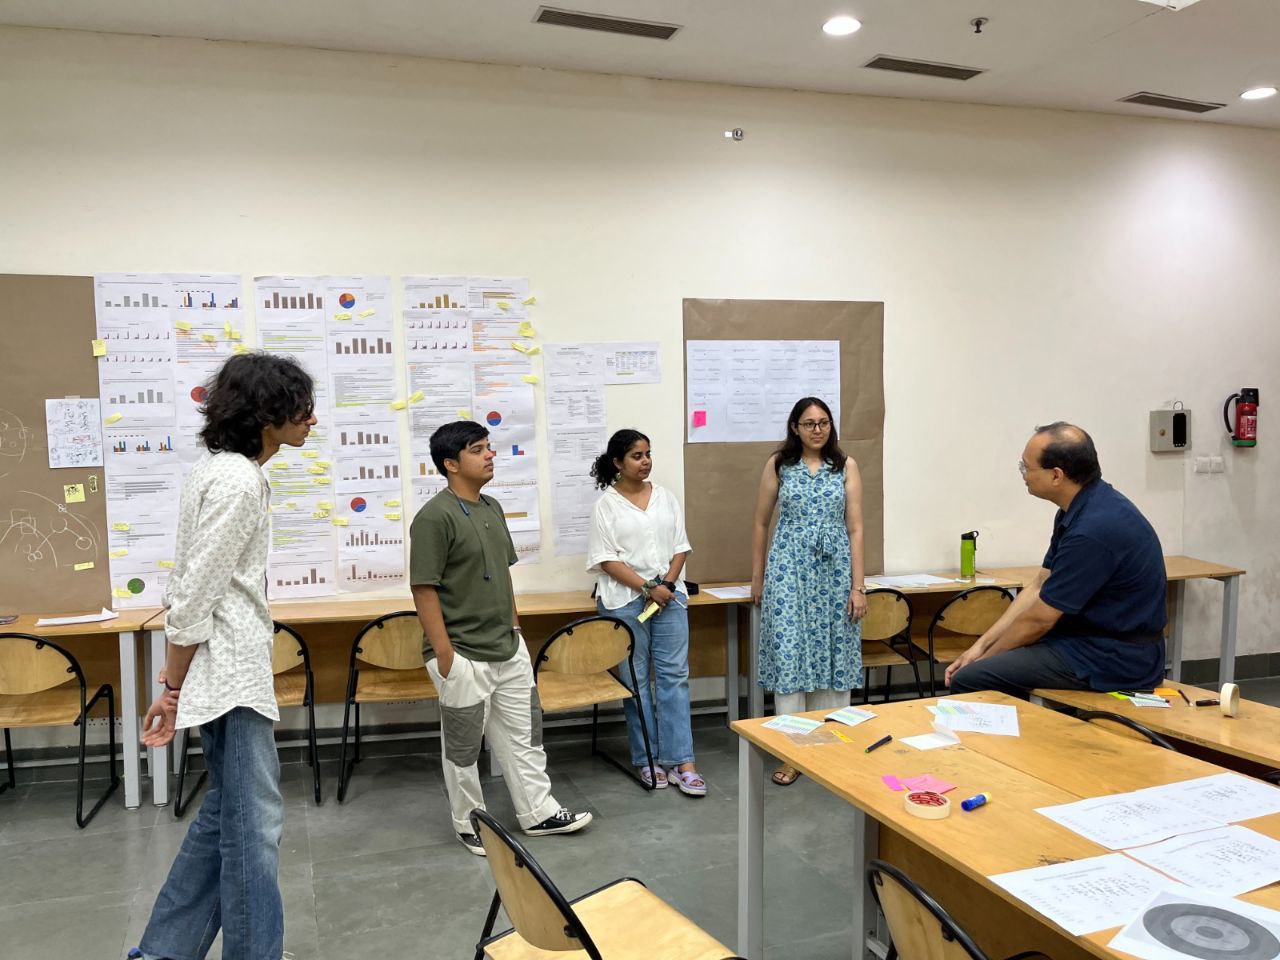
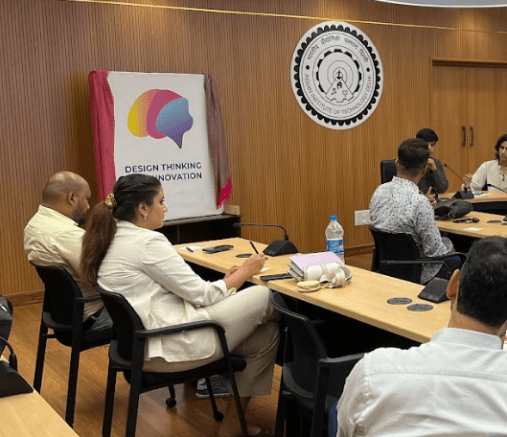
Phase 3: Focus Group
Phase 3: Focus Group
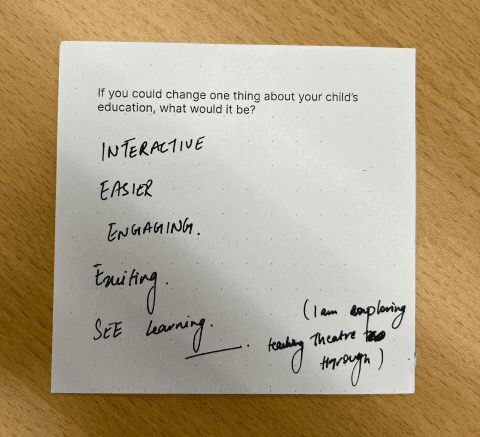
Focus groups were conducted to gather diverse perspectives, observe group dynamics and consider adjustments or innovations in response to identified areas of concern
Focus groups were conducted to gather diverse perspectives, observe group dynamics and consider adjustments or innovations in response to identified areas of concern
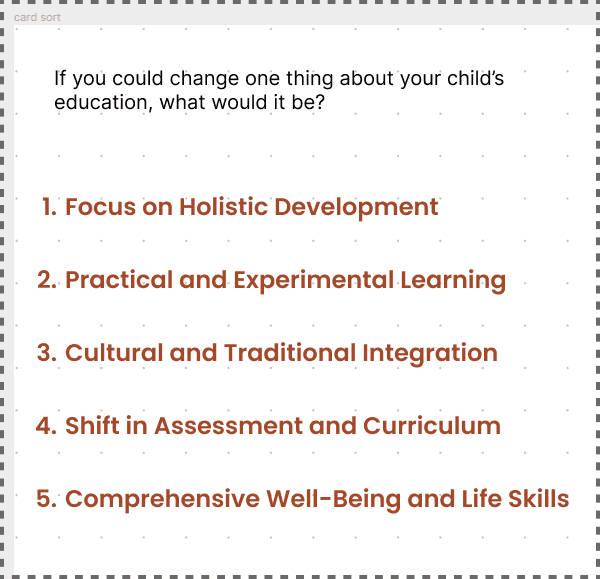
From this question what we wanted to know was:
From this question what we wanted to know was:
• Parental Priorities: Understand the respondent's key priorities and concerns regarding their child's education.
• Identifying Dissatisfaction: Specific aspects of the current education system that the respondent is dissatisfied with or considers suboptimal.
• Insights into Needs: Gain insights into the specific needs or expectations parents have regarding their child's learning environment and overall educational journey.

“ Innovation comes from understanding your stakeholders and empathizing with them“
-Dr. Amitoj Singh, BCG
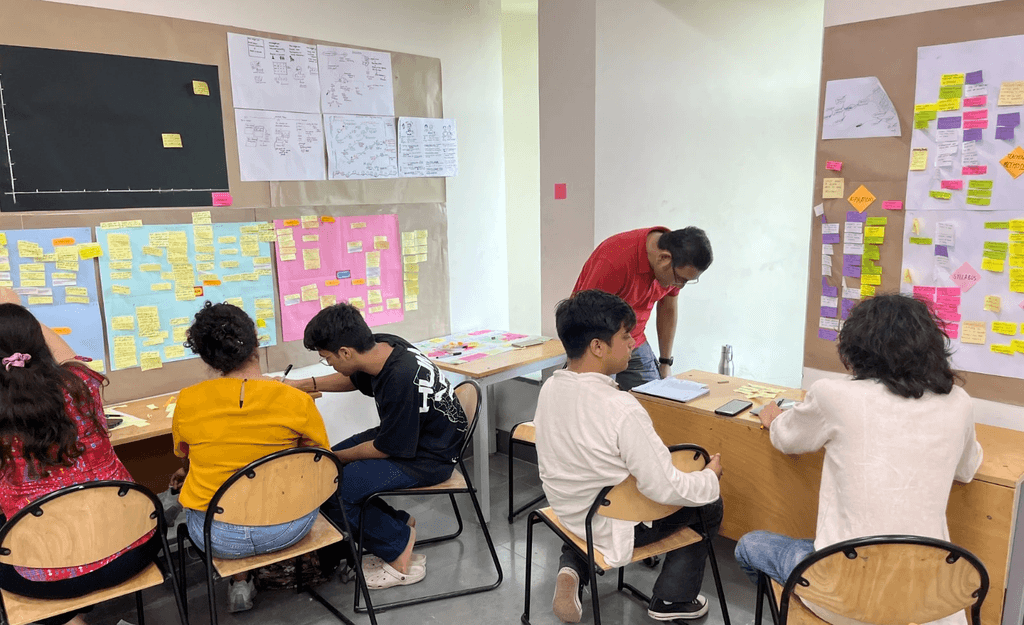
Brainboggling yet fun mentorship
Brainboggling yet fun mentorship
Gaurav, was our savior, he guided us and made sure we did things the right way
Gaurav, was our savior, he guided us and made sure we did things the right way


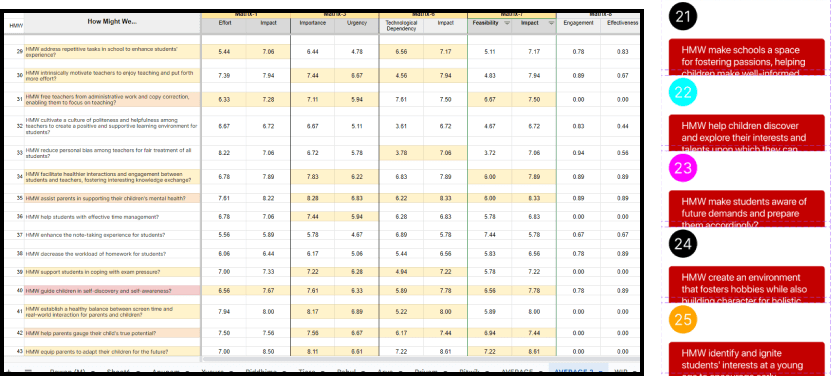
Phase 4: Action Priority Matrix
Phase 4: Action Priority Matrix
This matrix was used to help us determine which needs we need to focus on and in which order
This matrix was used to help us determine which needs we need to focus on and in which order
Matrices
Matrices
• Effort vs Impact
• Business Value vs Implementation Complexity
• Importance vs Urgency
• Growth Potential vs Relative Market
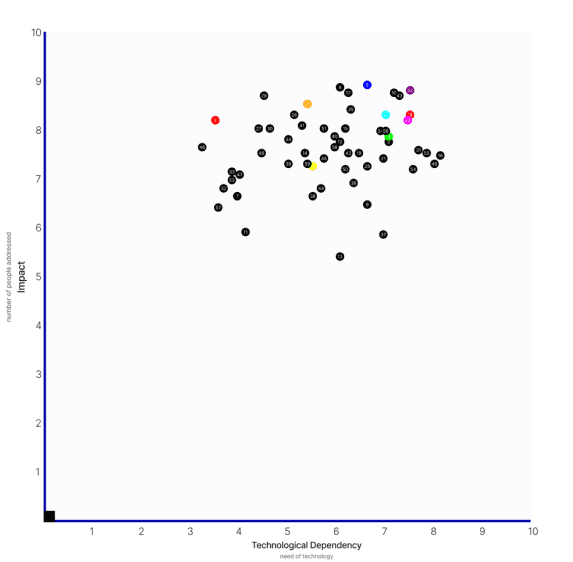
• Technological Dependency vs Impact
• Feasibility vs impact
• Engagement vs Effectiveness
• Effort vs Impact
• Business Value vs Implementation Complexity
• Importance vs Urgency
• Growth Potential vs Relative Market
• Technological Dependency vs Impact
• Feasibility vs impact
• Engagement vs Effectiveness
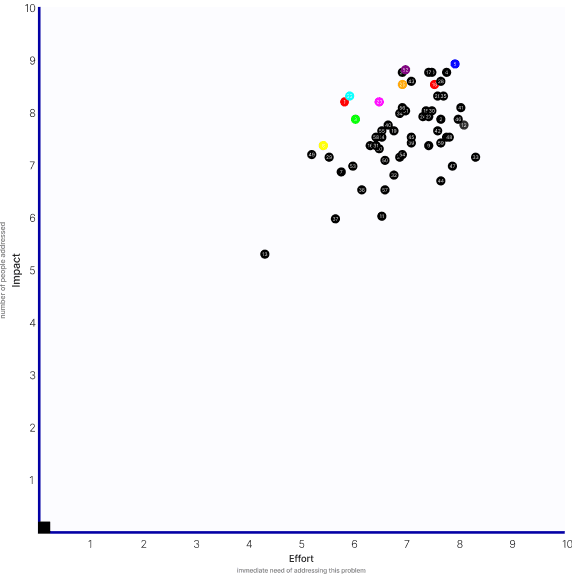
Graphical representation of the priority matrixes
Graphical representation of the priority matrixes
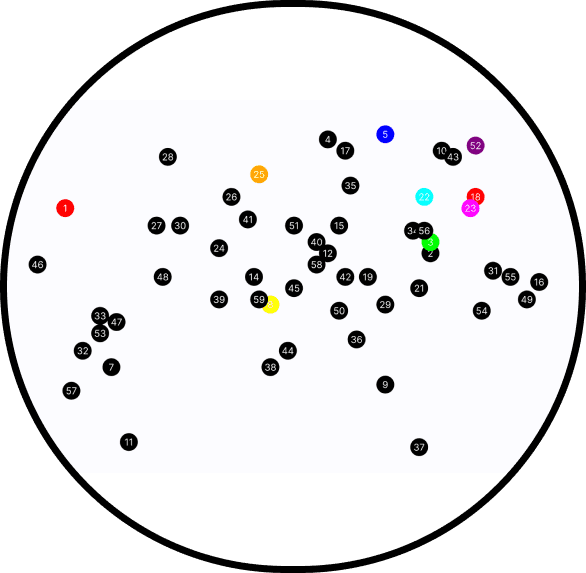
The calculated averages for each set of responses were then plotted on a graph
The graph allows researchers or analysts to interpret the overall trends and patterns in the data
(Specific colors were given to individual need statements to differentiate them from the rest on the graph)
The calculated averages for each set of responses were then plotted on a graph.
The graph allows researchers or analysts to interpret the overall trends and patterns in the data.
Specific colors were given to individual need statements to differentiate them from the rest on the graph
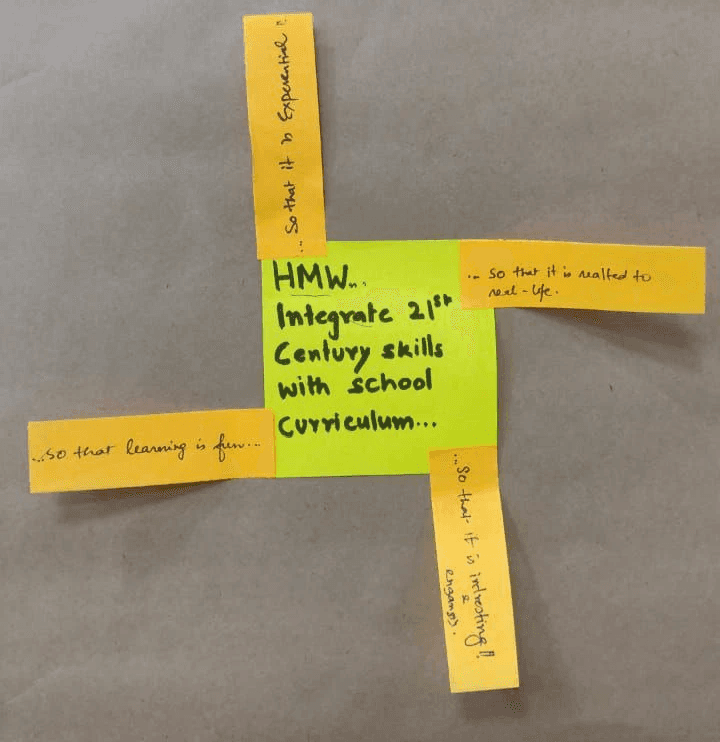
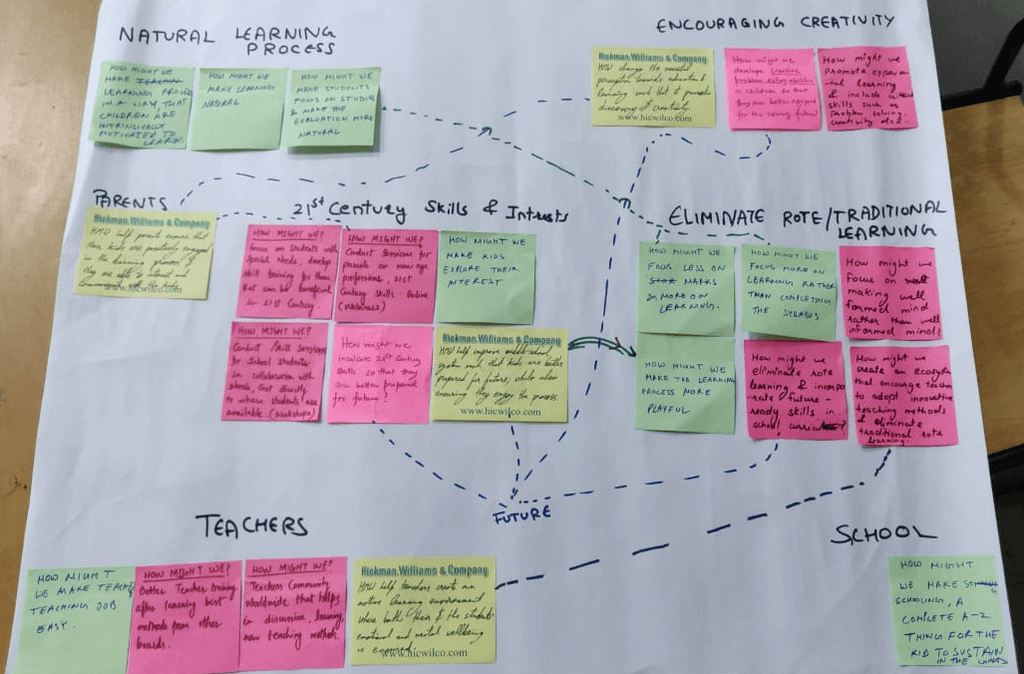
Shortlisted How Might We's
Shortlisted How Might We's
Plotted HMW statements on opportunity matrix to see which area has more need gap and problems
Plotted HMW statements on opportunity matrix to see which area has more need gap and problems
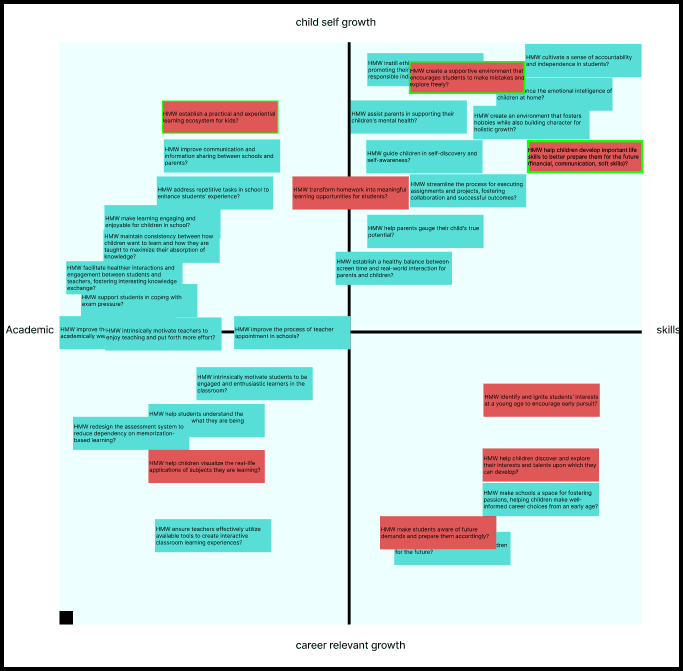
• HMW create a supportive environment that encourages students to make mistakes and explore freely?
• HMW establish a practical and experiential learning ecosystem for kids?
• HMW help children visualize the real-life applications of subjects they are learning?
• HMW make students aware of future demands and prepare them accordingly?
• HMW identify and ignite students' interests at a young age to encourage early pursuit?
“ The ecosystem around a child is what affects his growth and overall mind formation for life “
-Mr. Rahul Kamble, Pepsico
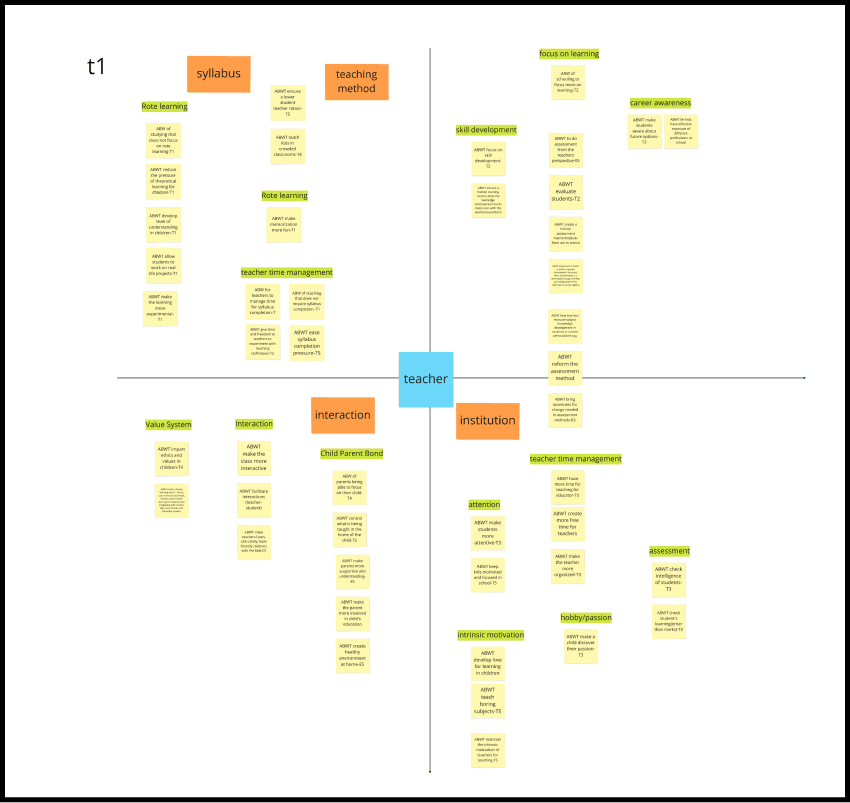
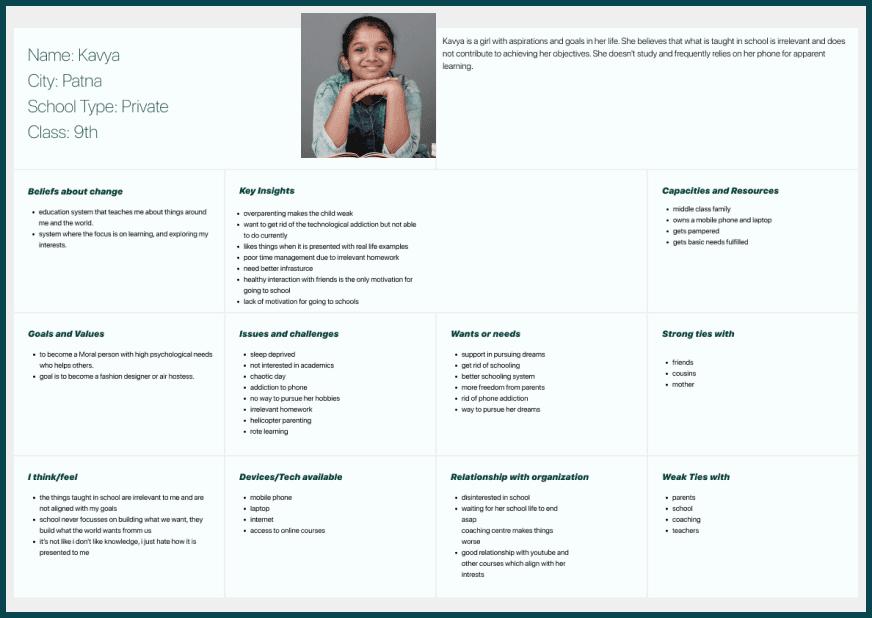
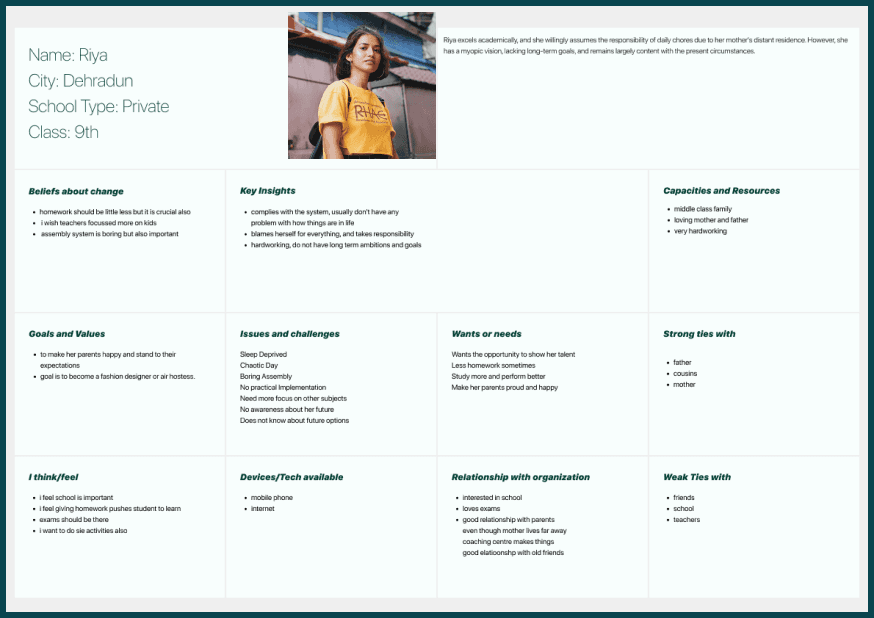
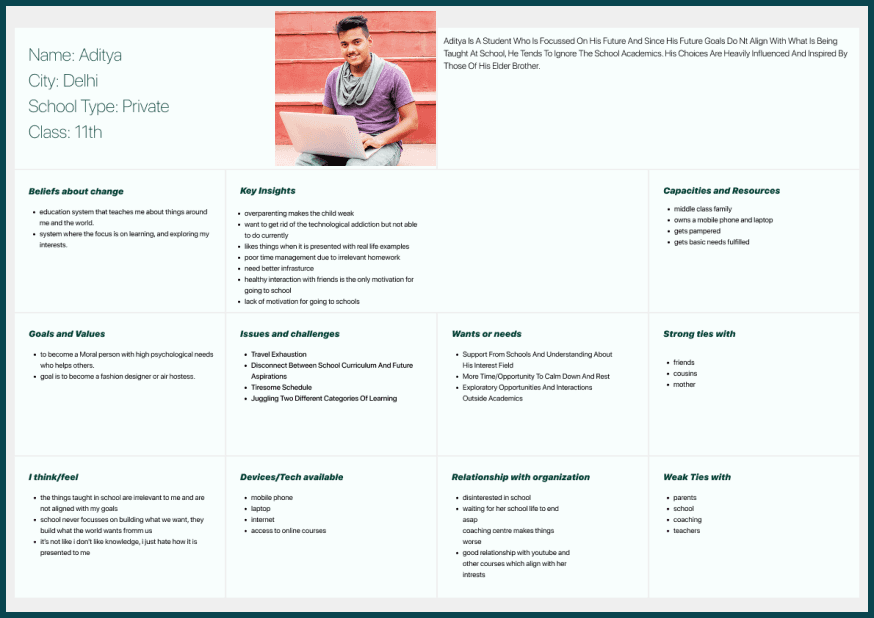
User Personas
User Personas
User personas for teachers, children, and parents created to develop a deeper understanding of the needs, preferences, and behaviors of each user group
User personas for teachers, children, and parents created to develop a deeper understanding of the needs, preferences, and behaviors of each user group
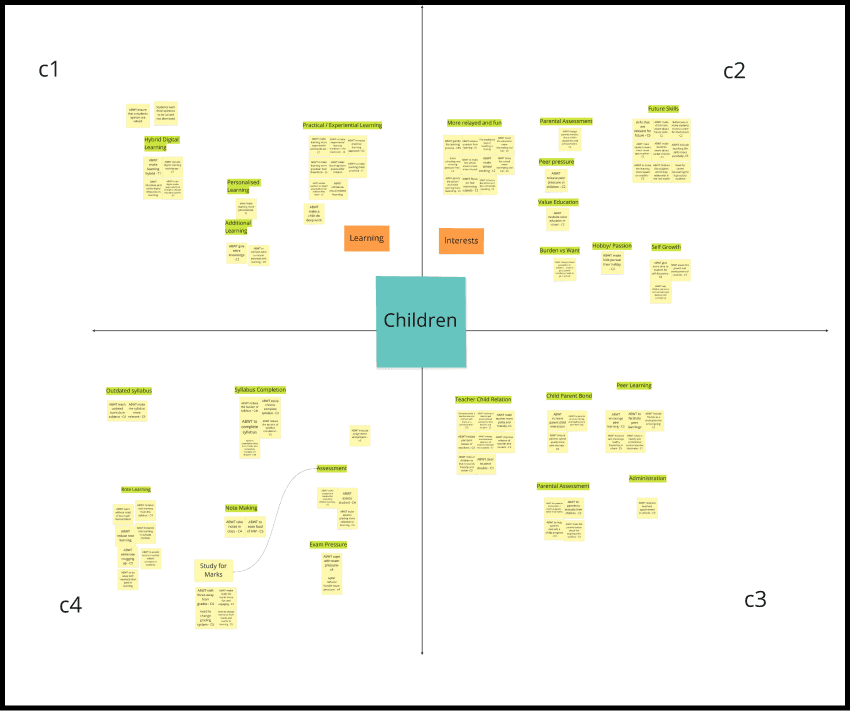
Stakeholder Mapping
Stakeholder Mapping
Used to identify, analyze, and visualize the relationships between various stakeholders around a child
With the help of stakeholder mapping we were able to draw clear visual representation of the stakeholder landscape and segregated all the high-influence stakeholders who may require regular collaboration in our solution

Making connections all around
Phase 5: Solution Brainstorming
Phase 5: Solution Brainstorming
We started to brainstorm ideas and possible solutions for the shortlisted HMW’s
We started to brainstorm ideas and possible solutions for the shortlisted HMW’s

With our mentor, Gaurav
Idea Refinement
Idea Refinement
A variety of solutions were developed for all 8 How Might We statements
The crude ideas were then refined to test the feasibility, technology requirement, future possibilities and business viability of each idea
A variety of solutions were developed for all 8 How Might We statements
The crude ideas were then refined to test the feasibility, technology requirement, future possibilities and business viability of each idea

One of the many ideas
Testing and Feedback
Testing and Feedback
Plausible solutions were validated by developing crude prototypes and applying them to current scenario and syllabus in schools to test outcomes
Plausible solutions were validated by developing crude prototypes and applying them to current scenario and syllabus in schools to test outcomes
Riddhima
India